The Problem With Rate Analysis
Rate analysis seems straightforward on paper: material costs, labor, equipment, overhead, and profit margins — plug and play. But, as any preconstruction director knows, the reality is far messier.
You’re flipping through 2,000-page rate books like CPWD DSR or RSMeans, cross-referencing catalogs, and manually updating bloated spreadsheets. Tack on inflation adjustments, regional cost differences, and scope changes, and it’s no wonder estimators spend significant time wrestling with this process (Construction Executive).
And here’s the kicker: one missed rate adjustment can throw off your entire estimate. For GCs chasing GMP pursuits or MEP subcontractors pricing tight-margin bids, those errors can be costly.
So, how do you master rate analysis without losing your mind? Let’s break it down.
The Anatomy of a Rate Analysis Formula
At its core, rate analysis boils down to this:
Rate = (Material Cost + Labor Cost + Equipment Cost) × (1 + Overhead % + Profit %)
Sounds simple, right? But applying it to real-world projects is where things get tricky. Here’s what preconstruction teams typically deal with:
-
Material Costs: These vary by supplier, region, and even the time of year. For example, structural steel prices in the US fluctuated significantly in 2022 (SteelBenchmarker).
-
Labor Costs: Union agreements, prevailing wage laws, and project-specific productivity factors all come into play. Site conditions, weather, and task complexity can also impact productivity.
-
Equipment Costs: Do you own the equipment? Renting? What about downtime or fuel escalation? These variables can swing costs significantly.
-
Overheads and Profit: Overhead percentages often get guessed or applied uniformly across projects, which is risky. Profit margins vary by market — what’s acceptable in one region might not work in another.
Let’s not forget inflation adjustments, currency conversions (for GCC or India markets), and tax regimes. It’s a lot to juggle.
A Step-by-Step Guide to Efficient Rate Analysis
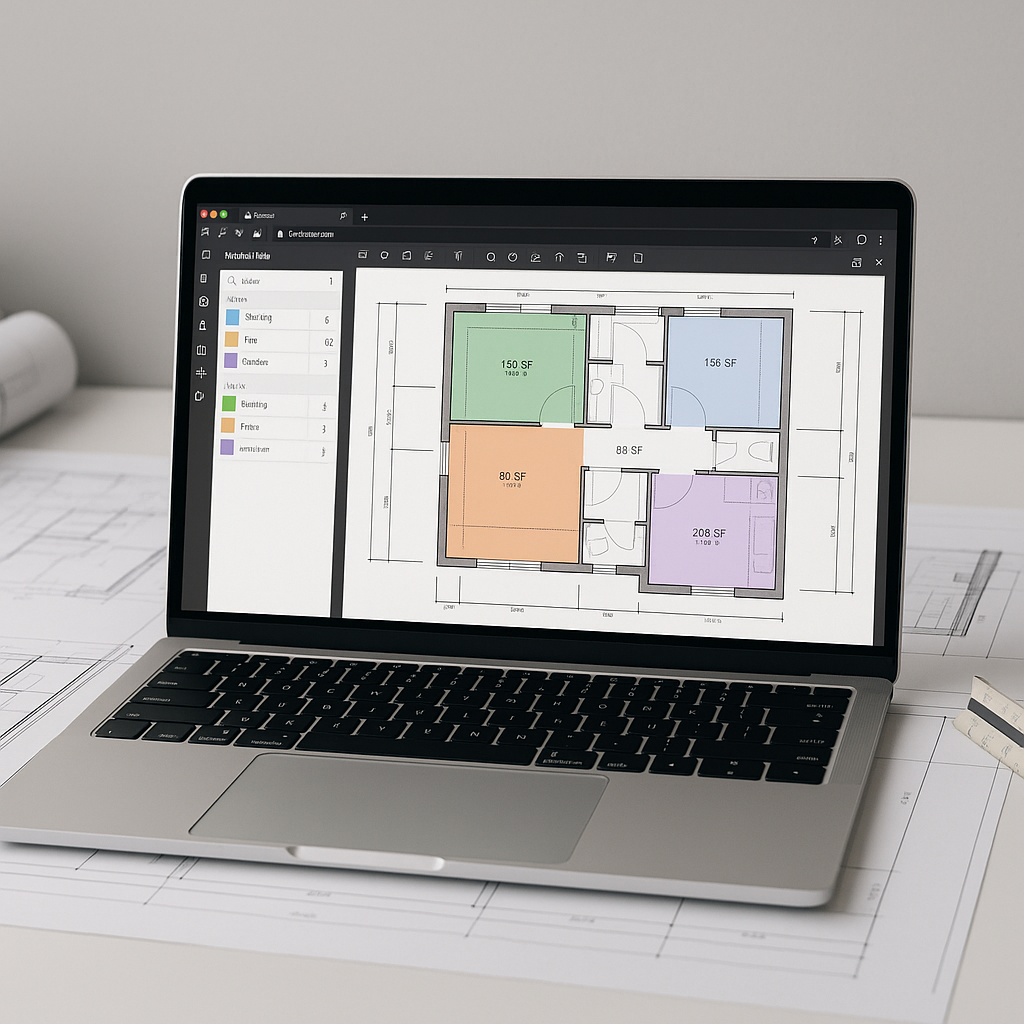
Step 1: Break Down the BOQ
Start by categorizing your Bill of Quantities (BOQ) into logical sections: materials, labor, equipment, overheads, and profit. This isn’t just for clarity — it ensures you’re not missing any line items.
Pro Tip: Use a smart BOQ parser to automatically structure your BOQ. It detects merged cells, section headers, and hierarchies, saving hours of manual cleanup.
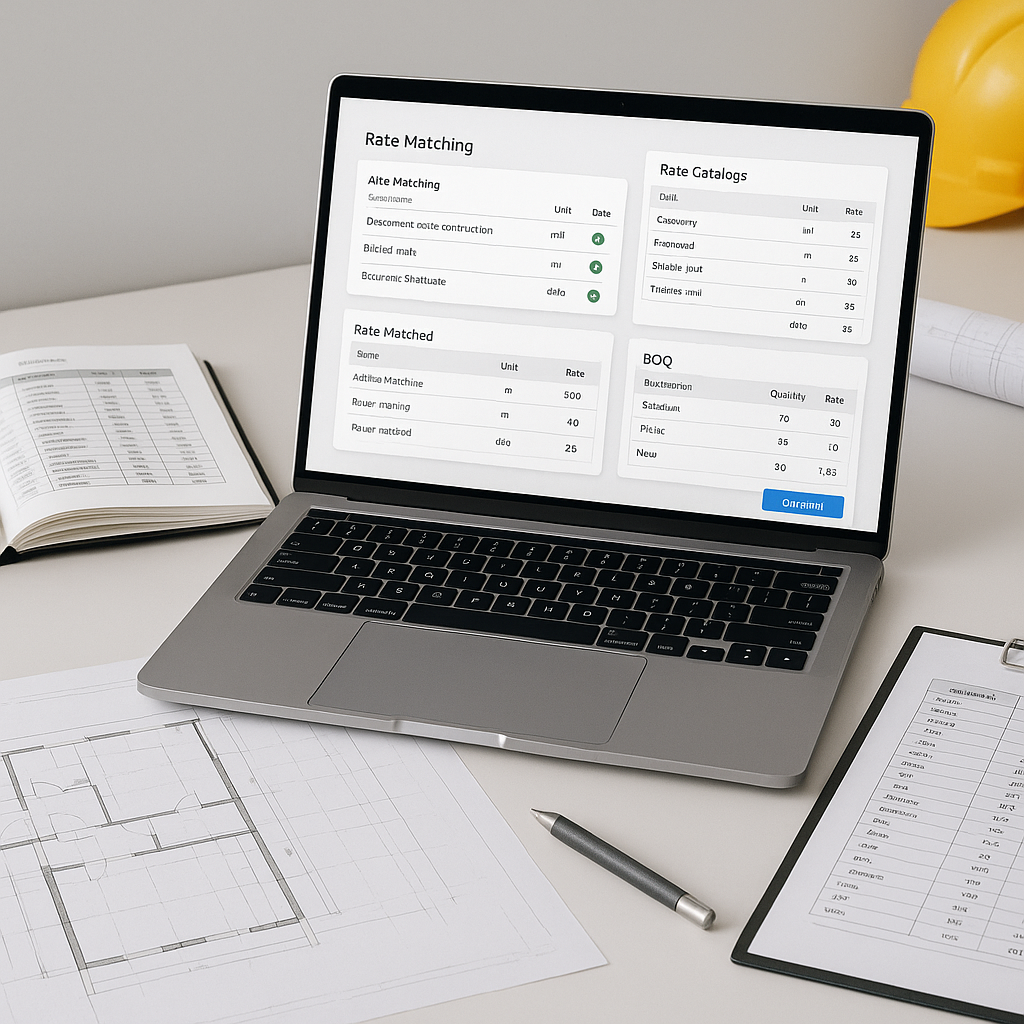
Step 2: Match Rates to Catalogs
Flipping through rate books like CPWD DSR or RSMeans? That’s a time sink. Instead, use tools that allow you to search for matching rates instantly.
Here’s how it works:
- Direct mapped rates (e.g., standard items with published rates)
- Assembly-derived rates (e.g., composite items built from multiple components)
- Hybrid rates (e.g., base rates adjusted for inflation or market conditions)
This eliminates the guesswork and ensures you’re working with accurate data.
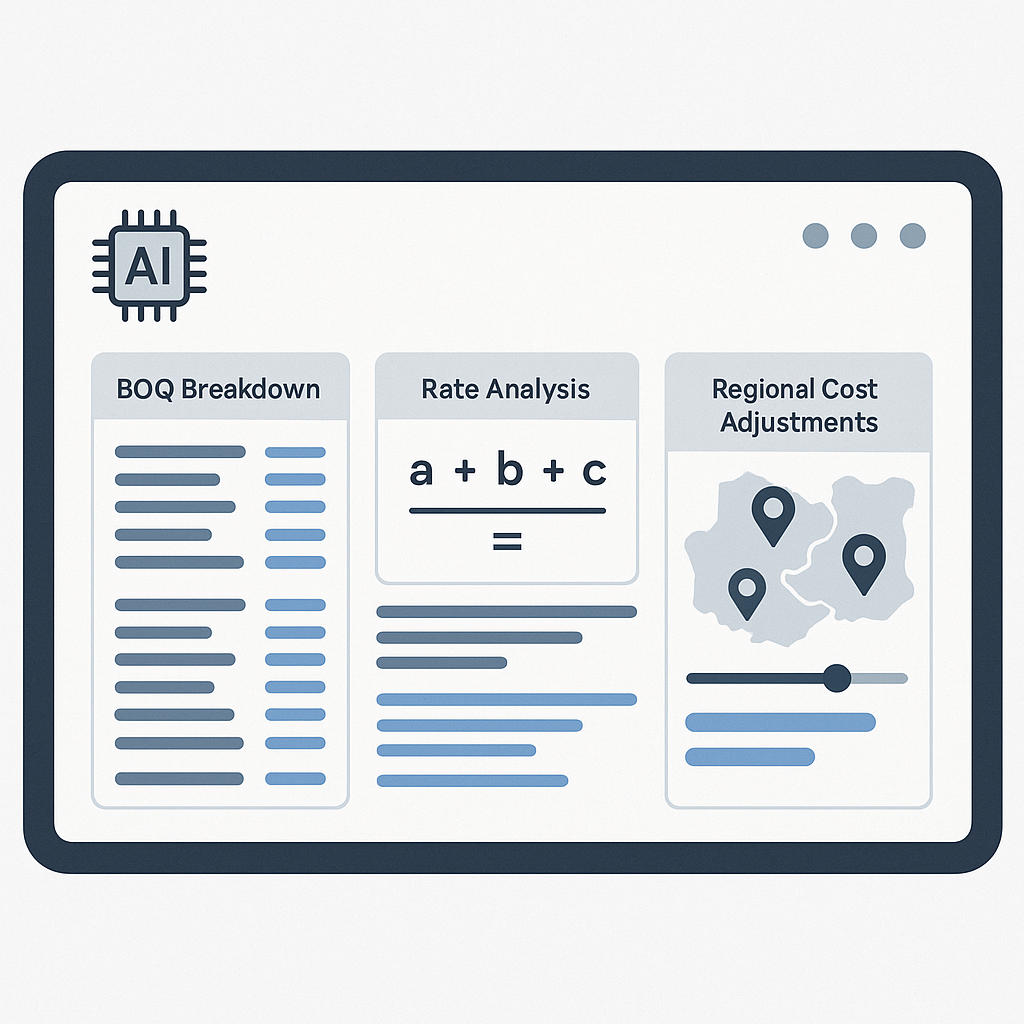
Step 3: Adjust for Local Factors
Rates aren’t universal. Adjust for:
- Regional Costs: Labor and material costs vary dramatically between states or countries.
- Inflation: Use compound adjustments to account for CPI changes.
- Market Profiles: Different markets (e.g., GCC vs. US) have unique standards like CESMM3 or CSI MasterFormat. Ensure your rate analysis aligns.
Step 4: Apply Overheads and Profit
Overhead and profit percentages should reflect the project’s risk profile. For example:
- High-risk projects (tight schedules, complex sites): Higher overhead and contingency.
- Low-risk projects (routine scopes, repeat clients): Lower margins to stay competitive.
Step 5: Generate a Transparent Audit Trail
Every rate needs a clear breakdown: material, labor, equipment, overhead, profit. Tools that generate structured workbooks showing every component can help justify rates to clients or internal teams.
Common Mistakes in Rate Analysis
1. Guessing Overheads
Assuming a flat overhead percentage across all projects can backfire. High-risk projects need more contingency.
2. Ignoring Inflation
Rates from an older catalog? Useless without adjustments. Always apply inflation factors.
3. Skipping Regional Adjustments
A rate from one region won’t apply to a project in another. Factor in local wages and material costs.
4. Manual Errors
Copy-pasting in Excel introduces errors. Automated tools reduce this risk by streamlining calculations and matching.
FAQs
Q: How do I adjust rates for inflation?
A: Use compound inflation adjustments. For example, if the catalog is three years old and inflation is 3% annually, apply a 9.27% increase (1.03³).
Q: What’s the best way to find regional rates?
A: Use location-specific indexes like RSMeans city cost indexes or CPWD DSR state schedules. Aggregated tools can also help streamline this process.
Q: Can AI really replace manual rate analysis?
A: Not completely, but it can significantly reduce repetitive tasks. You still need to validate high-impact rates manually.
Conclusion
Rate analysis doesn’t have to be a bottleneck. By breaking down the process, leveraging automation tools, and avoiding common pitfalls, you can save time while delivering more accurate bids.