Why Manual Rate Analysis Is Costing You More Than You Think
Let’s be honest—rate analysis isn’t glamorous, but it’s critical. Every general contractor knows the pain: breaking down materials, labor, equipment, and overhead for every activity in your BOQ (Bill of Quantities). Miss a single rate adjustment, and your estimate is off. Sometimes by a lot. For GCs chasing GMP (Guaranteed Maximum Price) pursuits, those errors can burn through margins fast.
How long does it take to build a rate breakdown manually? Most teams spend 2-4 hours per activity. Multiply that by 300-500 BOQ lines, and you’re looking at 1,500+ hours just to get through one tender[^4]. That’s weeks of effort you can’t afford to waste. And let’s not forget inflation adjustments, regional rate differences, or rework when the client changes scope halfway through pricing.
So, what’s the alternative? AI rate analysis. It’s not just faster—it’s smarter. Tools like EstimateNext can generate a full rate breakdown in seconds, not hours[^4]. Here’s how it works.
A Practical Example: Rate Analysis for Concrete Pouring
Let’s say your BOQ includes a line item for concrete pouring. The description reads:
| Activity | Unit | Quantity |
|---|---|---|
| Pouring M20 concrete | m³ | 250 |
Manually, you’d start by flipping through rate books like RSMeans or CPWD DSR to find a matching rate. Then, you’d break it down into components:
- Material: Cement, sand, aggregate, admixtures.
- Labor: Carpenters, masons, helpers.
- Equipment: Concrete mixers, vibrators, pumps.
- Overheads and Profit: Your markup for indirect costs.
Add taxes, adjust for inflation, and hope nothing was missed. If your team is lucky, this takes 3-4 hours. But here’s the kicker: What if the rate book doesn’t include a breakdown? You’ll be stuck reverse-engineering it from scratch.
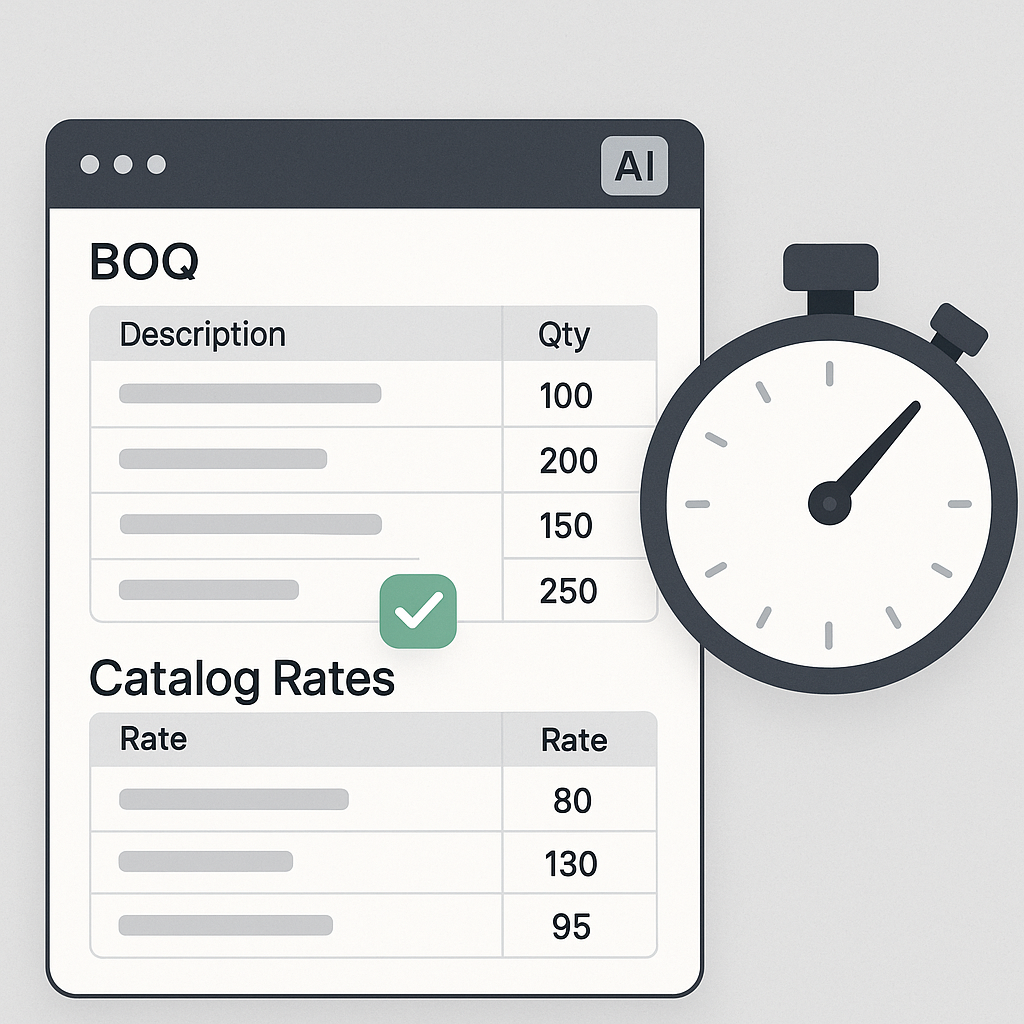
With AI-powered platforms like EstimateNext, it’s different. You upload the BOQ, and the system identifies the activity. For our concrete example, the platform quickly matches it with corresponding rates from a database of over 78,000 items[^1]. If no direct match exists, it builds a composite rate using material, labor, and equipment benchmarks. The result? A rate breakdown in under 30 seconds:
| Component | Unit Cost | Quantity | Subtotal |
|---|---|---|---|
| Cement (50kg) | $5.00 | 1,000 | $5,000.00 |
| Sand (m³) | $20.00 | 50 | $1,000.00 |
| Aggregate (m³) | $30.00 | 100 | $3,000.00 |
| Labor (hours) | $15.00 | 200 | $3,000.00 |
| Equipment | $1,200.00 | 1 | $1,200.00 |
| Total | $13,200.00 |
Actionable Steps for Manual Analysis
If you’re relying on manual methods, here’s how you can optimize your workflow:
- Use Templates: Create standardized breakdown templates for common activities like concrete pouring, excavation, and tiling.
- Leverage Rate Libraries: Invest in comprehensive rate books like RSMeans or CPWD DSR for quick referencing.
- Factor Inflation Automatically: Use Excel formulas to apply CPI adjustments to rates.
- Cross-Check Rates: Always review rates with a senior estimator or project manager to avoid errors.
Even with these steps, manual analysis is labor-intensive and prone to mistakes, especially for large tenders.
How AI Handles the “What-If” Scenarios
Here’s a scenario: midway through pricing, the client decides to switch from M20 to M25 concrete. Manually, you’d have to rework every dependent rate in your spreadsheet. Miss one, and you’re in trouble.
With EstimateNext, it’s instant. Update the activity to M25, and the platform recalculates all affected rates in real-time[^2]. It even flags any low-confidence matches for review, so you’re not flying blind. The best part? You get a full audit trail, so no one’s asking, “Who changed this rate and why?”
Comparison Table: Manual vs. AI-Powered Rate Analysis
| Feature | Manual Analysis | AI-Powered Analysis |
|---|---|---|
| Time per BOQ line | 2-4 hours | ~30 seconds |
| Risk of human error | High | Minimal (flagged matches) |
| Inflation adjustments | Manual CPI inputs | Auto-applied via CPI data |
| Rework for scope changes | Time-intensive | Instant recalculations |
| Audit trail | Limited | Comprehensive logs |
The ROI You Can’t Ignore
Let’s break down the real cost savings. If you’re a GC estimator earning $130/hour, saving 1,500 hours per tender translates to $195,000 in labor cost savings per pursuit[^4]. That’s just the direct impact. Faster rate analysis also means responding to more bids, improving your win rate. For MEP subs, this could mean 4-8 additional wins annually, each worth $200,000[^2]. That’s $800,000 to $1.6M in incremental revenue.
The math is brutal if you’re not using tools like EstimateNext. Competitors like CostX or RSMeans charge $5K-$15K annually, and you’re still stuck doing manual adjustments. EstimateNext costs $99/month and delivers 10X faster results[^4]. You don’t need to be a CFO to see the value.
FAQs About Rate Analysis
1. How accurate is AI rate analysis? AI systems like EstimateNext use a 4-step matching process to ensure accuracy. It cross-references historical data, user-curated catalogs, and current market rates[^1]. Low-confidence matches are flagged for review.
2. Can it handle multi-country projects? Yes. The platform supports multiple standards like CSI, NRM2, CPWD, and CESMM3. It also adjusts for regional labor rates, currencies, and tax regimes[^10].
3. What if a rate isn’t in the database? If no direct match exists, the system builds a hybrid rate using benchmark data and applies market adjustments[^1]. You can manually override if needed.
4. Does it integrate with existing tools? Yes. EstimateNext exports to Excel, Procore, and AIA G703 formats[^10].
5. What’s the learning curve? Minimal. The BOQ parser auto-detects hierarchies and merged cells, so you’re up and running in minutes[^1].
Ready to Simplify Rate Analysis?
Manual rate analysis wastes time and money. EstimateNext’s AI-powered platform changes that. Get started free →