You Already Know Your Win Rate. You Just Don't Track It.
Every estimating director has a feel for which projects their firm wins. Hospital projects in the $20-50M range with design-build delivery — good odds. Government highway tenders under $10M with 15 competitors — slim chance. But "feel" is not data. And without data, you cannot optimise.
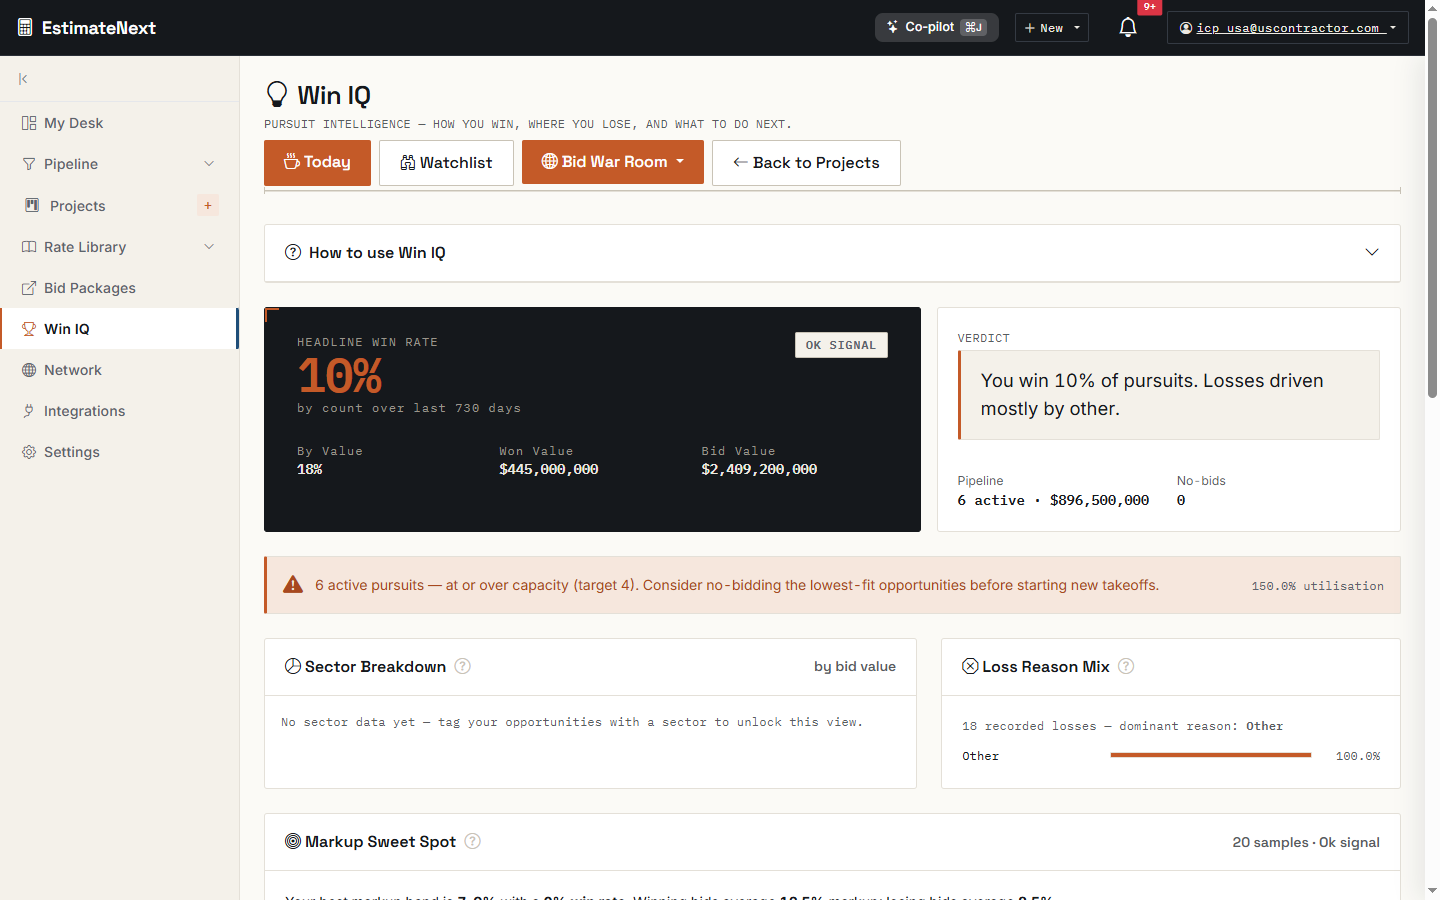
Win IQ turns your bid history into a prediction engine. Not by magic — by systematic analysis of what you bid, what you won, and what changed between your estimate and the winning price.
The Margin Sweet Spot
Every firm has a margin sweet spot — the markup range where they win a disproportionate share of tenders. Too low and you leave money on the table (or raise red flags about your ability to deliver). Too high and you are simply not competitive.
The problem is finding that sweet spot without trial and error. Traditional approach: bid at 8%, lose. Bid at 6%, win but barely break even. Bid at 7%, sometimes win, sometimes lose. Over 50 tenders, you might converge on the right number — but that is two years of learning at 10-15 tenders per quarter.
Win IQ analyses your bid history and shows you:
- Win rate by margin band: You might find that you win 35% of tenders at 6-7% margin but only 12% at 8-9%. That one-point difference in margin changes your win probability by 3x.
- Win rate by project type: Your margin sweet spot for hospitals (where you have specialist expertise) might be 2 points higher than for offices (where you compete with generalists).
- Win rate by client type: Government clients with mandated lowest-price evaluation have a very different optimal margin than private clients who weigh quality and methodology.
Post-Mortem Analysis
Win IQ is most powerful when you lose. A structured post-mortem on every lost tender asks:
- How far were you from the winning price?
- Were there specific trades where your rates were uncompetitive?
- Did the winner have a technical or relationship advantage?
- Were your preliminaries and general conditions in line with the market?
Over time, patterns emerge. You might discover that your MEP subcontractor rates are consistently 8-12% higher than what winners are paying. Or that your preliminary costs are competitive but your measured works are high because you are using outdated catalogue rates.
Proactive Insights Before You Bid
The real value of Win IQ is not retrospective — it is predictive. When a new tender comes in, Win IQ tells you:
- Your historical win rate for similar projects based on type, size, client, and delivery method
- The optimal margin range based on your past performance in this segment
- Specific risk factors such as trades where you have been consistently uncompetitive
- Capacity impact — how this tender fits your current workload and team availability
This is the information you need for a quality go/no-go decision (see our post on the 26-point rubric). Win IQ provides the data; your team provides the judgment.
The Portfolio View
Individual tender decisions matter, but portfolio strategy matters more. Win IQ shows your overall pipeline:
- Current tender pipeline with win probability for each
- Expected revenue based on pipeline value × win probability
- Capacity utilisation if you win your expected share
- Revenue risk if key tenders are lost
This portfolio view helps you calibrate your pursuit intensity. If your pipeline is strong (high expected revenue, good capacity utilisation), you can be more selective and bid at higher margins. If your pipeline is thin, you might need to pursue more aggressively, accepting lower margins to maintain workflow.
Real Numbers: What Win IQ Reveals
A mid-size GC tracked 80 tenders over 18 months. Win IQ analysis revealed:
- Overall win rate: 14% (slightly above industry average)
- Win rate on invited tenders: 28%
- Win rate on open tenders: 6%
- Margin sweet spot: 6.5-7.5% — below 6.5% they won but did not make money; above 7.5% they rarely won
- Strongest segment: Healthcare design-build, 38% win rate
- Weakest segment: Government civil works, 4% win rate
Armed with this data, the firm adjusted its strategy:
- Stopped pursuing government civil tenders (saving 200+ estimation hours per quarter)
- Focused on healthcare and education design-build
- Adjusted margins to the sweet spot for each segment
- Result: win rate improved to 22%, margin improved by 1.2 points, and estimation team capacity increased by 30% because they were bidding fewer, better-targeted tenders
The Feedback Loop
Win IQ gets better as you use it because it is learning from your specific history, your specific market, and your specific competitive dynamics. A firm that has tracked 200 tenders has dramatically better predictions than one that has tracked 20.
EstimateNext tracks every tender outcome and continuously refines its predictions. The margin sweet spot shifts as market conditions change, and Win IQ shifts with it.
Getting Started
You do not need 200 tenders to start. Enter your last 20-30 tenders with their outcomes (won, lost, declined), your bid price, and the winning price (if known). Win IQ will give you preliminary insights that improve with every new data point.
Ready to find your margin sweet spot? See Win IQ in action and bring your tender history.
Ready to see EstimateNext in action?
AI-powered preconstruction estimation platform — from BOQ upload to priced bid package in minutes. 78K+ SOR items, 7 specialist trade tools, bid intelligence, and a procurement network.
Get Started Free →